A Comprehensive Guide to Stock Turnover
Efficient inventory management is a cornerstone of any successful business, directly impacting profitability and operational fluidity․ One of the most critical metrics for assessing this efficiency is stock turnover, also known as inventory turnover․ This ratio reveals how many times a company has sold and replaced its inventory over a specific period․ Understanding how to accurately calculate stock turnover provides invaluable insights into sales performance, purchasing strategies, and potential issues like overstocking or stockouts; This comprehensive guide will walk you through the formula, its components, and the interpretation of the results to help optimize your business operations․
What is Stock Turnover and Why Does This Metric Matter?
Stock turnover is a financial ratio that measures how efficiently a business is managing its inventory․ Specifically, it indicates the number of times inventory is sold and replenished within a given period, typically a year․ A higher turnover rate generally implies that goods are being sold quickly, which can lead to lower holding costs and reduced risk of obsolescence․ Conversely, a low turnover rate might suggest weak sales, excessive inventory, or inefficient purchasing․
This metric is crucial for several reasons:
- Optimized Cash Flow: Selling inventory faster frees up capital that can be reinvested into the business․
- Reduced Holding Costs: Less time spent holding inventory means lower storage, insurance, and obsolescence costs․
- Improved Profitability: Efficient turnover ensures that capital is not tied up in slow-moving goods, allowing for better returns on investment․
- Better Forecasting: Analyzing turnover trends helps businesses make more accurate predictions about future demand and purchasing needs․
- Identifying Issues: A sudden drop or sustained low turnover can signal problems with product desirability, pricing, or marketing efforts․
Unpacking the Stock Turnover Formula
The fundamental formula for calculating stock turnover is straightforward․ It requires two primary components: the Cost of Goods Sold (COGS) and the Average Inventory value․ These figures are typically taken from your company’s income statement and balance sheet for the period you wish to analyze․
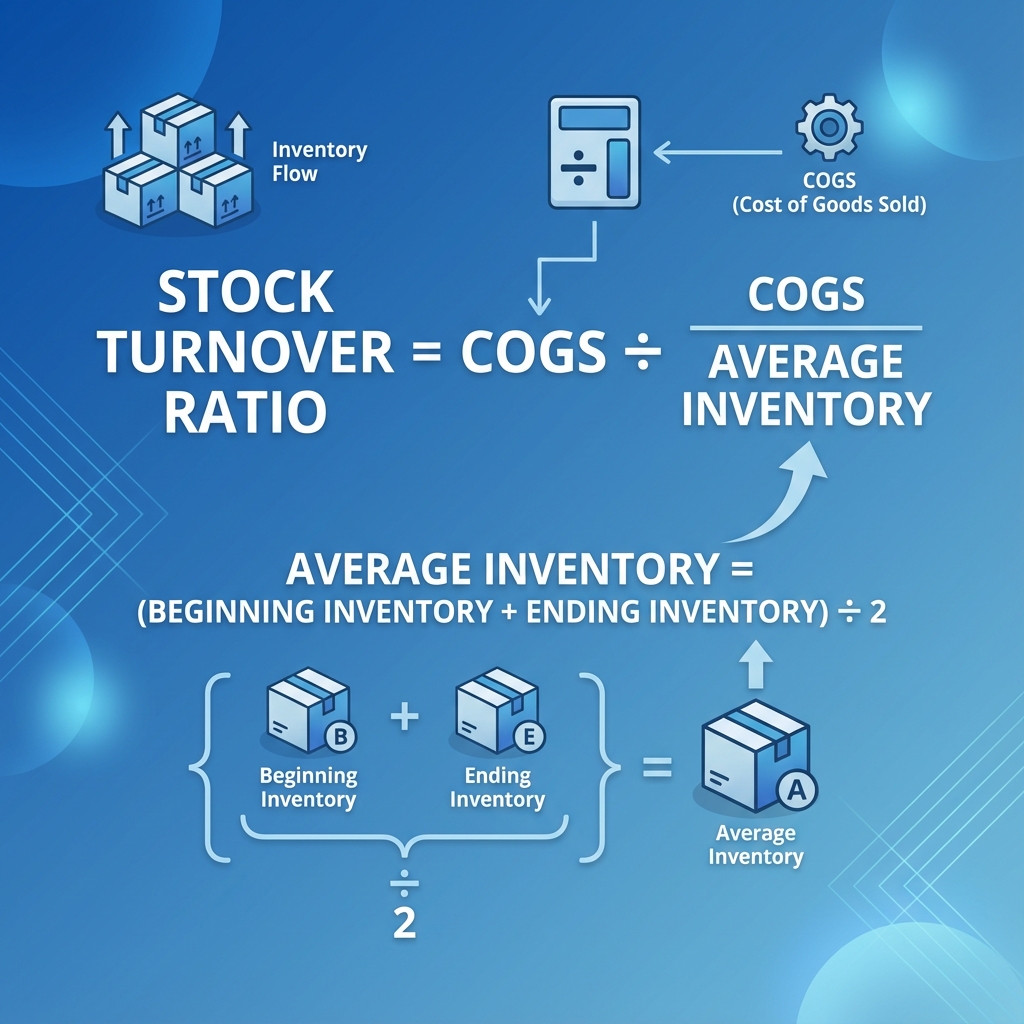
The core formula is:
Stock Turnover Ratio = Cost of Goods Sold / Average Inventory
Calculating the Cost of Goods Sold (COGS)
The Cost of Goods Sold represents the direct costs attributable to the production of the goods sold by a company․ This amount includes the cost of the materials used to create the goods, plus direct labor costs․ It excludes indirect expenses like marketing or administrative salaries․ To determine COGS for a specific period, you will need to know your beginning inventory, purchases made during the period, and ending inventory․
The formula for COGS is:
COGS = Beginning Inventory + Purchases ⎻ Ending Inventory
For example, if a business started the year with $50,000 in inventory, made $200,000 in purchases, and ended the year with $40,000 in inventory, its COGS would be:
$50,000 (Beginning Inventory) + $200,000 (Purchases) ⎻ $40,000 (Ending Inventory) = $210,000 (COGS)
Determining Average Inventory
Average inventory smooths out fluctuations in inventory levels that might occur throughout the period․ Using an average provides a more accurate representation than simply using the beginning or ending inventory balance․ It is calculated by adding the value of your beginning inventory to the value of your ending inventory and then dividing the sum by two․
The formula for Average Inventory is:
Average Inventory = (Beginning Inventory + Ending Inventory) / 2
Using the example above, with a beginning inventory of $50,000 and an ending inventory of $40,000, the average inventory would be:
($50,000 + $40,000) / 2 = $90,000 / 2 = $45,000 (Average Inventory)
Step-by-Step Guide to Calculating Your Inventory Turnover Rate
Follow these straightforward steps to accurately calculate your inventory turnover rate for any given period:
- Identify Your Reporting Period: Decide whether you want to calculate turnover for a month, quarter, or year․ Consistency is key for comparison․
- Calculate Your Cost of Goods Sold (COGS): Gather your financial records for the chosen period to find the beginning inventory, total purchases, and ending inventory․ Apply the COGS formula․
- Calculate Your Average Inventory: Use the beginning and ending inventory values for the same period to compute the average inventory․
- Apply the Stock Turnover Formula: Divide the calculated COGS by the average inventory․ The result is your stock turnover ratio․
- Interpret the Result: Understand what the number means in the context of your industry and business goals․
Continuing our example: COGS = $210,000, Average Inventory = $45,000․
Stock Turnover Ratio = $210,000 / $45,000 = 4․67 times
This means the company sold and replenished its entire inventory approximately 4․67 times during the period․
Interpreting Your Stock Turnover Ratio
Once you have calculated your stock turnover ratio, the next crucial step is to understand what it signifies for your business․ The “ideal” turnover rate varies significantly across industries․ For instance, grocery stores typically have a very high turnover due to perishable goods, while luxury car dealerships might have a much lower rate․ Comparing your ratio against industry benchmarks and your company’s historical performance provides valuable context․
Here’s a general guide to interpreting different turnover rates:
| Turnover Ratio | Interpretation | Potential Implications |
|---|---|---|
| High Turnover | Inventory is selling quickly and efficiently․ |
|
| Low Turnover | Inventory is selling slowly or is accumulating․ |
|
| Optimal Turnover | Balanced selling and replenishment, minimizing costs and maximizing sales․ |
Write a quality, in-depth, magazine-style article on the topic: Write in English Use a clickbait and catchy headline. Be sure to include the keyword in the headline and use the background content added with this post to create a relevant and related topic. Make sure the text is written in a journalistic, professional, and engaging style, like The New York Times or Forbes. The tone should be optimistic, forward-looking, and persuasive. Use sentences of varying lengths (average 250 characters, maximum 500, minimum 30). Use appropriate analogies, descriptive adverbs (e.g., “incredibly effective”), and correct adverbial phrases (e.g., “By integrating insights from AI…”). Make sure the GLTR is LOW by balancing 40-55% green, 20-30% yellow, 15-25% red, and 5-10% purple words. Use present and past participles to add dynamism. Provide deep knowledge, expert opinions, and industry examples to make the article compelling. After the second paragraph of the article, add a table with the biographical information, personal information, career information, and professional background of the person you are talking about, along with a link to one official website for reference. The table should be in a format that is easy to embed in WordPress. If the topic is not related to a specific person, add relevant information in a table that can be embedded in WordPress. After the second paragraph of the article add table with bio data and personal information, career, professional information of person in topic, also add link to one authentic website for reference, the table should be in the form that it can be easily inserted in wordpress. If the topic is other than person related than add related information in the form of table that can be inserted in wordpress. |
Strategies to Optimize Your Inventory Turnover
Improving your stock turnover rate can significantly enhance profitability and operational efficiency․ Implementing targeted strategies can help you achieve a healthier balance between meeting demand and minimizing carrying costs․ Consider these approaches:
- Enhance Demand Forecasting: Utilize historical data, market trends, and predictive analytics to more accurately forecast customer demand․ Better forecasts lead to more precise purchasing and reduced excess inventory․
- Strengthen Supplier Relationships: Negotiate favorable terms with suppliers, including shorter lead times and options for just-in-time (JIT) delivery․ Reliable suppliers can help you maintain lower safety stock levels․
- Implement Advanced Inventory Management Systems: Use software to track inventory levels in real-time, automate reordering, and identify slow-moving or obsolete items․ Such systems provide crucial data for decision-making․
- Optimize Pricing Strategies: Adjust pricing for slow-moving items through discounts or promotions to clear old stock․ Dynamic pricing can stimulate demand and improve turnover․
- Streamline Returns Management: Efficiently process and re-stock returned items to make them available for sale again quickly․ Minimize the time these items spend out of circulation․
- Improve Product Assortment: Regularly review your product catalog, discontinuing items with consistently low turnover and focusing on high-demand products․
Frequently Asked Questions About Stock Turnover
Is a high stock turnover always good?
Not always․ While a high turnover generally indicates strong sales and efficient inventory management, an excessively high turnover could mean you’re experiencing stockouts, leading to lost sales opportunities and potentially dissatisfied customers․ It might also suggest that you’re purchasing in very small quantities, missing out on bulk discounts․
How often should I calculate stock turnover?
The frequency depends on your business needs and industry․ Many businesses calculate it annually or quarterly for financial reporting․ However, for fast-moving consumer goods or highly seasonal businesses, monthly or even weekly calculations can provide more timely insights for operational adjustments․
What’s the difference between inventory turnover and sales turnover?
Inventory turnover specifically measures how quickly inventory is sold and replaced․ Sales turnover, often just referred to as “revenue” or “sales,” is the total amount of money generated from sales during a period․ While both are critical, inventory turnover focuses on efficiency in managing physical goods, whereas sales turnover focuses on the top-line income generated․
Can I use sales revenue instead of COGS in the formula?
While some simplified calculations might use sales revenue, it is generally recommended to use the Cost of Goods Sold (COGS)․ Sales revenue includes profit margins, which distorts the true cost of the inventory being turned over․ Using COGS provides a more accurate measure of the efficiency of inventory management at its cost basis․
Understanding and actively managing your stock turnover rate is undeniably vital for the financial health and operational agility of any business․ It serves as a powerful indicator, revealing not just sales performance but also the effectiveness of your purchasing and inventory control processes․ By consistently calculating this ratio and comparing it against benchmarks, you can identify areas for improvement and implement strategic adjustments․ Ultimately, optimizing stock turnover allows companies to reduce carrying costs, minimize waste, and free up capital for growth and reinvestment․ Embrace this metric to drive smarter inventory decisions and foster a more profitable, responsive business model․
